Healthcare has become one of India’s largest sectors. There is one stock in Healthcare Sector Company Can be MultiBegger Returns. In both terms of revenue and employment. As the Indian economy is growing very fast. Healthcare comprises hospitals, medical devices, clinical trials, outsourcing, telemedicine, medical tourism, health insurance, and medical equipment. The Indian healthcare sector is growing at a brisk pace due to its strengthening coverage, services, and increasing expenditure by public as well as private players
The Indian healthcare sector is experiencing phenomenal growth, fueled by rising healthcare awareness, an expanding middle class, and government initiatives. This growth presents exciting opportunities for investors seeking multi-bagger returns – stocks that experience exponential growth currently trading at the Support level.
KPR Mills Share Price Target 2025| Given Target Achieved
Healthcare Sector Company Can be MultiBegger Returns?
Yes, stock can be multibegger returns. In Jan 2018 Stock price was Rs 1321.15 and now the stock trading at Rs 4763.
| Stock Past Returns | ||||
| Years | Jan | Dec. | Change Price | Change % |
| 2015 | 805.95 | 776.6 | -29.35 | -3.78 |
| 2016 | 778.3 | 999.3 | 221 | 22.12 |
| 2017 | 981.35 | 1289.75 | 308.4 | 23.91 |
| 2018 | 1321.15 | 3078.7 | 1757.55 | 57.09 |
| 2019 | 3156.65 | 4366.7 | 1210.05 | 27.71 |
| 2020 | 4408.35 | 6817.5 | 2409.15 | 35.34 |
| 2021 | 6980.8 | 5338.4 | -1642.4 | -30.77 |
| 2022 | 5251.5 | 3953 | -1298.5 | -32.85 |
| 2023 | 4001.75 | 4947.75 | 946 | 19.12 |
Procter & Gamble Health Ltd Stock Technical Analysis

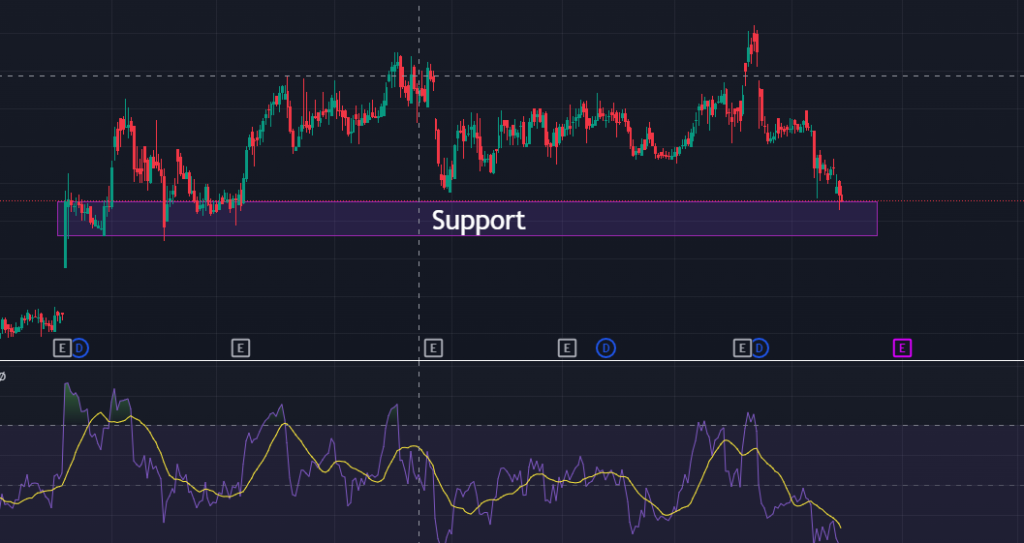
As you see in the chart sock is trading near to support. Already 3 times stock type support on this box. RSI value also shows that the stock is at good support. Stock is already Corrected by 16.5% from its recent high. In the past three days stock delivery has been very high. on Mar 26 stock delivery was 93.3%, Mar 27 84.9%, and on 28 March 91.6% which was very high. It simply means that investors are bullish on this stock.
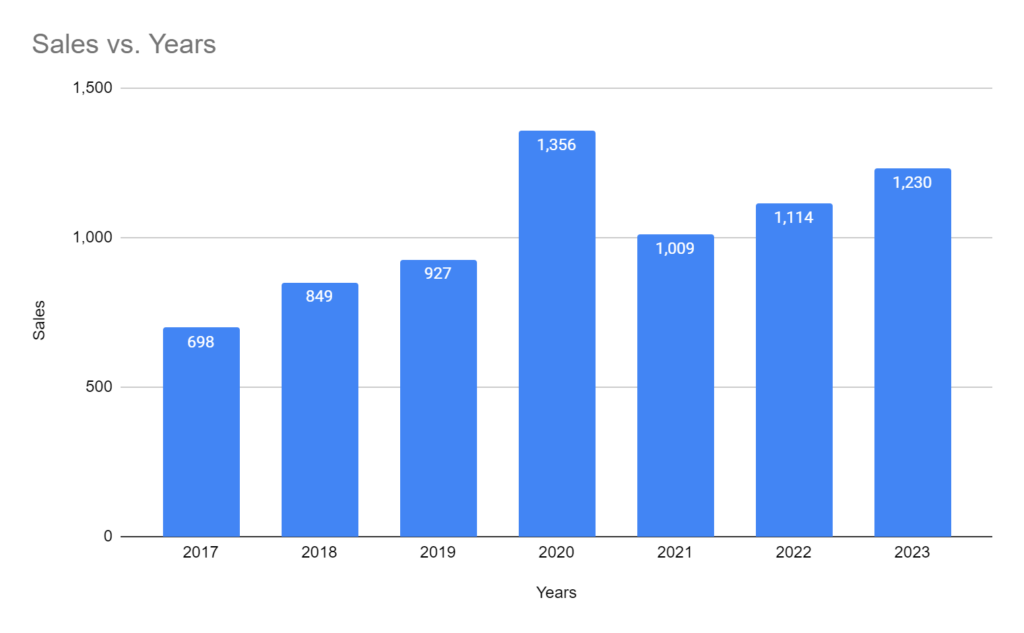
Procter & Gamble Health Ltd MultiBegger Returns Sales Growth

Procter & Gamble Health Ltd Promoters Holding
| Years | Mar 2022 | Mar 2023 | Dec 2023 |
| Promoters + | 51.82% | 51.82% | 51.82% |
| FIIs + | 6.57% | 6.72% | 7.60% |
| DIIs + | 7.91% | 12.31% | 12.66% |
| Public + | 33.71% | 29.14% | 27.92% |
| No. of Shareholders | 66,289 | 61,030 | 56,730 |
Procter & Gamble Health Ltd Operating Profit Vs Net Profit

P&G MultiBegger Returns Stock Support and Resistance
This chart is on the monthly time frame. Plotted Support and resistance Support 1 shows recent support and Support 2 if support one is broken.

1 Jun 2020 stock is trading near Rs 4071 at support 2 after that stock gives 88.8% move upside.
Is P&G a Good Stock to Buy Now
Yes, It’s a Good time to buy now because of stock at his support level and sustain this level with high delivery.
The Company Stock Dividend History is as follows.
| Announcement Date | Ex-Date | Dividend Type | Dividend (%) | Dividend (Rs) |
| 20-01-2024 | 09-02-2024 | Interim | 1000 | 100 |
| 31-01-2024 | 09-02-2024 | Special | 600 | 60 |
| 28-08-2023 | 17-11-2023 | Final | 1050 | 105 |
| 10-01-2023 | 08-02-2023 | Interim | 800 | 80 |
| 23-08-2022 | 04-11-2022 | Final | 650 | 65 |
| 27-01-2022 | 08-02-2022 | Interim | 950 | 95 |
| 25-08-2021 | 09-11-2021 | Final | 800 | 80 |
| 26-04-2021 | 11-05-2021 | Interim | 0 | 0 |
| 26-04-2021 | 11-05-2021 | Special | 1500 | 150 |
| 28-01-2021 | 10-02-2021 | Interim | 850 | 85 |
| 26-08-2020 | 13-11-2020 | Final | 1050 | 105 |
| 21-08-2019 | 19-11-2019 | Final | 480 | 48 |
| 07-02-2019 | 15-02-2019 | Interim | 400 | 40 |
| 23-08-2018 | 20-11-2018 | Final | 400 | 40 |
| 30-08-2017 | 07-11-2017 | Final | 270 | 27 |
| 08-05-2017 | 17-05-2017 | Special | 3620 | 362 |
| 26-08-2016 | 24-11-2016 | Final | 360 | 36 |
| 28-08-2015 | 19-10-2015 | Final | 302.5 | 30.25 |
| 13-08-2014 | 08-09-2014 | Final | 275 | 27.5 |
| 14-08-2013 | 21-11-2013 | Final | 250 | 25 |
| 24-08-2012 | 20-11-2012 | Final | 225 | 22.5 |
| 25-08-2011 | 04-11-2011 | Final | 225 | 22.5 |
| 19-08-2010 | 23-09-2010 | Final | 225 | 22.5 |
| 28-08-2009 | 29-09-2009 | Final | 225 | 22.5 |
| 26-08-2008 | 25-09-2008 | Final | 200 | 20 |
| 27-08-2007 | 27-09-2007 | Final | 200 | 20 |
| 17-08-2006 | 21-09-2006 | Final | 250 | 25 |
| 05-09-2005 | 10-11-2005 | Final | 400 | 40 |
| 13-08-2004 | 29-09-2004 | Final | 200 | 20 |
| 09-09-2003 | 25-09-2003 | Final | 200 | 20 |
| 05-08-2002 | 11-09-2002 | Final | 0 | 0 |
| 28-08-2001 | 04-09-2001 | Final | 375 | 0 |
| 10-05-2000 | 12-05-2000 | Final | 75 | 0 |
According to Motilal Oswal’s research currently They are bullish on stock. They suggest HOLD Stock. Not only Motilal Oswal another broker firm also suggests the same for HOLD.
Conclusion
Operational efficiency is good for the company. Healthcare organizations usually have high debt loads and low equity capital in their balance sheet. So, the Debt to Equity ratio is important to analyze the company’s sustainability. Procter&Gamble Health has a debt-to-equity ratio of 0, which is a strong indication for the company.
This article is for Educational purpose .Do not invest on behalf of information provided in the article. Please consult an expert before making decisions We are not SEBI registered advisor .
FAQ
Procter and Gamble Share Price Target 2030?
Procter and Gamble’s Share Price Target for 2030 is a minimum of Rs 6200 and a maximum of Rs 6400.
Procter and Gamble Share Price Target 2025?
Procter and Gamble Share Price Target 2025 minimum is Rs 4800 and maximum is Rs 5100.
